|

|
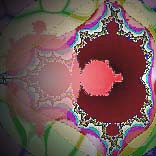
basis: mandelbrot-fractal z(0) = c = pixel; |
|
|
This set is the classic, named after Benoît Mandelbrot: the only one implemented in many plotting programs, and the source of most of the printed fractal images published in recent years. It is simply a graph: the x (horizontal) and y (vertical) coordinate axes represent ranges of two independent quantities, with various colors used to symbolize levels of a third quantity which depends on the first two. So far, so good: basic analytic geometry. |